Dental Practice Benchmarks: 12 Numbers Every Dental Office Should Track

Dental Practice Benchmarks: 12 Numbers Every Dental Office Should Track
Is your dental practice performing well? It's a surprisingly difficult question to answer. A full schedule can feel like success while collections lag behind. New patient numbers can climb while existing patients quietly disappear. Production can increase while overhead grows even faster.
That's why successful dental practices don't rely entirely on how busy the office feels. They measure.
Dental practice benchmarks and key performance indicators (KPIs) give owners and managers a clearer view of what's actually happening across the business. This includes everything from production and collections to patient retention, recare, scheduling, and case acceptance.
But there's an important distinction: Not every dental KPI has a universal benchmark.
Some metrics have useful industry reference points. Others depend heavily on your practice model, specialty, payer mix, geography, capacity, and goals. The most useful scorecard combines both. External benchmarks tell you how your numbers compare. Internal benchmarks tell you whether your practice is getting better.
Here are 12 numbers worth knowing.
What Are Dental Practice Benchmarks?
Dental practice benchmarks are reference points used to evaluate the financial, operational, and patient-performance metrics of a dental office. A benchmark might be an industry target, a peer comparison, or simply your practice's own historical performance.
For example, the American Dental Association identifies production, collections, profit, overhead, new patients, case acceptance, hygiene production, recare scheduling, and cancellation/no-show rates among commonly tracked dental KPIs.
The point isn't to chase someone else's numbers blindly. It's to make your practice visible. If you know where performance is changing, you can investigate why.
Dental Practice Benchmarks at a Glance
Here are several published reference points from ADA practice-management guidance:
KPI | Published ADA Reference Point |
|---|---|
Collections | 98% of billable/adjusted production |
Overall overhead | 63% or less of total income |
New-patient growth | 10–15% annually |
Case acceptance | At least 75–80% |
Doctor vs. hygiene production | Approximately 75% / 25% |
Patients active in recare | At least 85% |
Recare patients with next appointment scheduled | 90% |
Cancellation + no-show rate | 5% or less |
We believe these figures are best treated as reference points, not commandments.
That's because practice economics vary substantially. Even ADA material addressing practice purchases notes that insurance participation, patient mix, staffing, laboratory needs, and other factors can materially affect a practice's numbers.
The more useful question isn't simply:
"Am I above or below the benchmark?"
It's:
"Why is my number what it is, and what is the trend telling me?"
1. Production
Production is one of the foundational dental practice KPIs. At its simplest, it measures the value of dentistry produced during a given period.
Track it:
Daily
Weekly
Monthly
Annually
By provider
By department when useful
But don't stop at total production. A growing practice should understand what is creating the production.
Is growth coming from more patients?
Higher-value procedures?
Greater provider capacity?
Better case acceptance?
Fee increases?
More hygiene activity?
The number tells you what happened, and the underlying system tells you why.
What to watch
Compare production against the same period last year and against your own goals. A single slow week isn't necessarily meaningful, but a sustained change in the trend is.
2. Collections
It's important to understand that production isn't the same as money collected. That's why collections deserve their own place on the scorecard. The ADA's practice-management guidance uses 98% of billable or adjusted production as a collections reference point.
That distinction, adjusted rather than gross production, is important because contractual write-offs and other legitimate adjustments may mean the practice never expects to collect its full gross production.
If production looks healthy but collections don't follow, investigate:
Accounts receivable
Patient payment processes
Insurance delays
Billing workflows
Collection policies
Adjustments and write-offs
A productive practice can still experience cash-flow problems if it doesn't collect effectively.
3. Overhead
Overhead tells you how much of the practice's income is being consumed by the cost of operating it. ADA practice-management guidance has historically cited 63% or less of total income as a general reference point. More recent ADA material discussing practice financing describes overhead for a well-run general practice as commonly falling around 58% to 68%.
That range illustrates exactly why benchmarks require context. Your overhead depends on factors including:
Staffing
Rent and occupancy
Supplies
Lab expenses
Technology
Specialty
Payer mix
Geography
Practice maturity
Instead of obsessing over one universal percentage, track your major expense categories and monitor how they change relative to collections.
If revenue grows 5% while expenses grow 15%, the top-line number can hide a real problem.
4. New Patients
New-patient volume tells you whether new people are entering the practice. You need to track both
How many new patients are coming in?
and
Where are they coming from?
Referral source matters. A patient referred by an existing patient tells you something different from a patient generated by paid advertising.
The ADA has cited 10–15% annual new-patient growth as a general reference point, but raw growth isn't always the goal. A mature practice with a full schedule may not need aggressive new-patient growth. A newer practice probably does.
The better question is: Are we attracting enough of the right patients to support our capacity and growth goals?
5. New-Patient Conversion
New-patient count tells you who arrived, but it doesn't tell you who tried to arrive. That distinction matters.
Suppose 100 prospective patients contact your practice and 40 schedule. Another practice receives 70 inquiries and schedules 50. The first office technically generated more opportunities. The second converted them more effectively.
Track the journey from:
Inquiry → Conversation → Appointment → Arrival
This can reveal problems that won't appear in your practice-management production report. A marketing problem and a conversion problem can look remarkably similar if you only measure new-patient appointments.
6. Case Acceptance
Case acceptance measures how effectively diagnosed treatment becomes accepted treatment. ADA guidance uses 75–80% or higher as a reference point for case presentations.
But case acceptance requires careful measurement. A $150 procedure and a $15,000 treatment plan shouldn't necessarily be interpreted identically.
Consider tracking acceptance by:
Number of cases
Dollar value
Treatment category
Provider
New vs. existing patient
Low case acceptance doesn't automatically mean someone needs a better sales script. It can point to communication, trust, financing, scheduling, insurance, treatment presentation, or simply patient readiness. Use the KPI to identify the question, not prematurely decide the answer.
7. Hygiene Production
Hygiene isn't simply another line on the production report. It can be an indicator of the health of your patient base and recare system.
ADA practice-management guidance has cited a roughly 75% doctor / 25% hygiene production split as a healthy reference point. Again, your practice model matters.
But if hygiene contributes significantly less than expected, investigate the systems underneath it:
Are patients staying active?
Are they pre-appointed?
Is recare working?
Is hygiene capacity adequate?
Are there frequent holes in the schedule?
Are periodontal needs being appropriately identified and managed?
Hygiene performance can tell you a surprising amount about the rest of the practice.
8. Recare Performance
A recare list isn't a KPI. You need to know what happens to the people on it.
Useful recare measurements include:
Percentage of appropriate patients pre-appointed
Percentage active in recare
Percentage with a future appointment
Number of overdue patients
Reactivation rate
Completed recare visits
ADA guidance has referenced at least 85% of patients active in the recare system and 90% of recare patients scheduled for their next appointment.
But don't only look at the final number.
Follow the patient through the process:
Due → Reminded → Reached → Scheduled → Confirmed → Returned
If you know where patients fall off, you know where to improve.
9. Cancellation and No-Show Rate
A schedule can look full on Monday and develop holes by Thursday. That's why scheduled production alone can be misleading.
The ADA has used 5% or less as a combined cancellation/no-show reference point. Track cancellations and no-shows separately when possible, and look deeper than the percentage.
Ask:
When are cancellations happening?
Which appointment types are most affected?
Are cancelled appointments being rescheduled?
How much production is being lost?
How effectively are openings being refilled?
A cancellation isn't necessarily lost production if your systems recover it. The real KPI may be schedule recovery, not cancellations alone.
10. Active Patients and Patient Retention
A practice can acquire plenty of new patients without actually growing. Imagine adding 50 new patients this month while 60 existing patients quietly become inactive. Marketing looks successful, but the patient base is shrinking.
That's why active-patient count and retention belong beside new-patient acquisition on your scorecard. ADA policy defines an active patient of record based on dental services received within the previous 24 months, while patients who have received no dental services from the dentist for more than 24 months are considered inactive.
Your operational definition may be more specific depending on what you're measuring, but it should be consistent.
Track:
Active patients
New patients
Patients becoming inactive
Returning patients
Retention over time
Acquisition tells you how well the front door works. Retention tells you whether the back door is open.
11. Accounts Receivable
Revenue that exists only on paper doesn't pay payroll. Accounts receivable (A/R) tells you how much money is owed to the practice and how long it has remained unpaid.
Don't just monitor total A/R. Age it. Pay particular attention to balances that move beyond:
30 days
60 days
90 days
ADA guidance for evaluating a practice specifically flags receivables greater than two months of production and high balances over 90 days as potential warning signs.
A growing A/R balance can reveal issues with insurance follow-up, patient collections, billing workflows, or financial policies long before those issues become obvious elsewhere.
12. Patient Response and Communication Metrics
This is where traditional dental scorecards often have a blind spot. Practices measure what happens after an appointment gets onto the schedule. But what happens before that?
Consider tracking:
Call answer rate
Missed calls
Response time
New-patient inquiry conversion
After-hours inquiries
Scheduling completion
Abandoned conversations
Rescheduling success
These aren't substitutes for financial KPIs. They're leading indicators.
If production tells you what happened last month, communication metrics can help explain what might happen next month. For example, a sudden decline in new-patient appointments could originate with marketing.
Or the exact same number of prospects could be contacting the practice while fewer are successfully reaching someone and scheduling. Without communication data, those situations look identical.
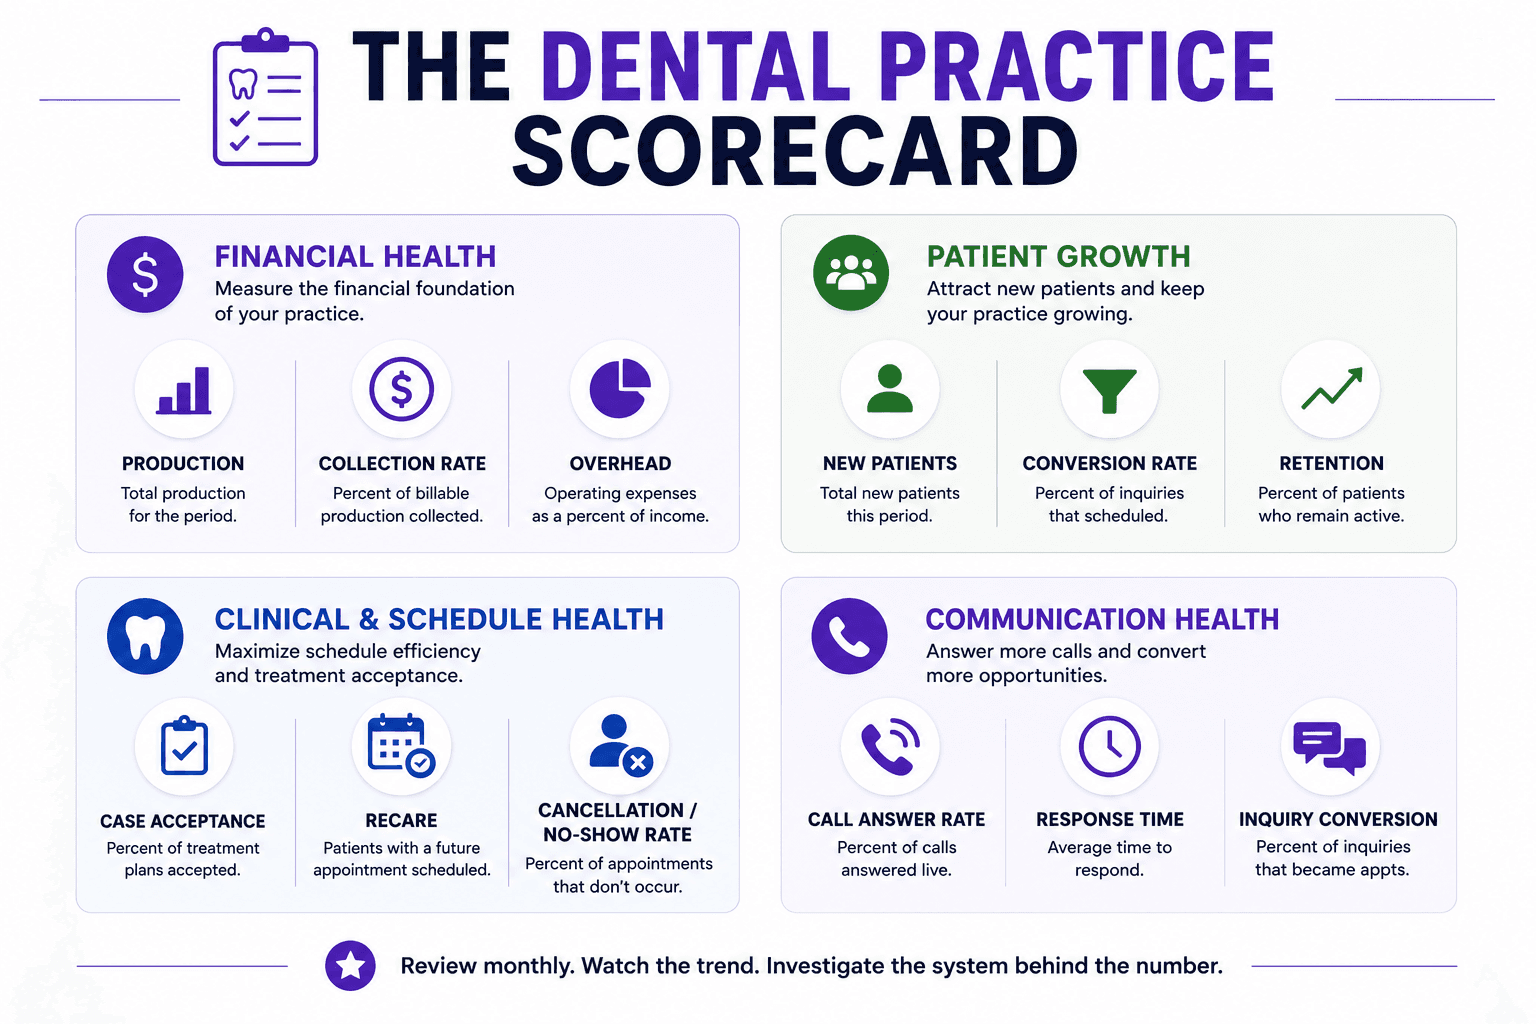
The Dental Practice Scorecard
The problem with tracking KPIs isn't usually a shortage of data. It's having too much of it.
A practice-management system can generate dozens of reports. Your accountant has another set. Marketing platforms have dashboards. Phones have call data. Scheduling systems have their own numbers.
The goal isn't to build the biggest dashboard. It's to build the smallest dashboard that tells you whether the practice is healthy. A useful Dental Practice Scorecard can be organized into four categories:
Financial Health
Production
Collections
Overhead
Accounts Receivable
Patient Growth
New Patients
New-Patient Conversion
Active Patients / Retention
Clinical & Schedule Health
Case Acceptance
Hygiene Production
Recare
Cancellations / No-Shows
Communication Health
Call Answer Rate
Response Time
Scheduling Completion
Together, these numbers tell a much richer story than production alone.
Leading vs. Lagging Dental KPIs
One of the most useful ways to think about dental practice metrics is to separate leading and lagging indicators.
Lagging indicators tell you what already happened.
Examples:
Production
Collections
Profit
Completed appointments
New patients
Leading indicators can signal what may happen next.
Examples:
Future schedule utilization
Recare appointments booked
Case acceptance
New-patient conversion
Response time
Missed calls
If you only measure lagging indicators, you're often diagnosing problems after they've already affected revenue. A strong scorecard includes both.
How Often Should Dental KPIs Be Reviewed?
Not every metric needs daily attention.
Daily
Keep the list short:
Production vs. goal
Schedule changes
Major open capacity
Weekly
Look at operational movement:
New patients
Cancellations/no-shows
Recare activity
Schedule utilization
Communication bottlenecks
Monthly
This is where the complete scorecard comes together:
Production
Collections
Overhead
A/R
New patients
Case acceptance
Hygiene
Recare
Retention
Schedule performance
Communication
Quarterly
Zoom out and ask: What trends are developing?
A KPI becomes far more valuable when you can see six or twelve months of history instead of a single snapshot.
Don't Chase Benchmarks Blindly
Imagine your case acceptance increases from 62% to 72%. You might still be below a published reference point, but you've made meaningful progress.
Now imagine another practice sits at 82%, but was at 90% six months ago. It's above the benchmark, but moving in the wrong direction. Which practice should be more concerned? Benchmarks provide context. Trends provide direction.
That's why your own historical performance may eventually become the most useful benchmark you have.
What Should You Do When a KPI Is Off?
Don't immediately try to fix the number. Find the system producing it.
If new patients decline, investigate:
Marketing → inquiries → calls answered → scheduling → arrivals
If hygiene production declines, investigate:
Active patients → recare → pre-appointment → cancellations → hygiene capacity
If collections decline, investigate:
Production → billing → insurance → patient balances → follow-up
If case acceptance declines, investigate:
Diagnosis → presentation → understanding → trust → affordability → scheduling
Every KPI is an output. Somewhere upstream is a process creating it.
Where Annie Fits
Communication metrics are only one part of a healthy dental practice, but they influence more of the scorecard than you might expect. An unanswered call can affect new-patient conversion. A difficult scheduling experience can affect recare. Slow responses can affect patient experience. Front-desk interruptions can affect efficiency.
Annie helps practices answer calls, assist with scheduling, handle routine patient questions, and maintain consistent communication without adding another task to an already busy front desk. The point isn't to replace the practice scorecard with an AI dashboard. It's to strengthen one of the systems feeding the numbers that matter.
Start With a One-Page Dental Practice Scorecard
You don't need 50 KPIs. Start with 10 or 12 that genuinely reflect the health of your practice.
Give each metric:
Current result
Goal or benchmark
Previous period
12-month trend
Owner
Then review the scorecard consistently. The conversation changes from: "I feel like we've been slower lately."
to:
"New-patient inquiries are stable, but conversion has fallen for three consecutive months. Let's figure out why."
That's the real value of dental practice benchmarks. They replace assumptions with questions you can answer.
Frequently Asked Questions About Dental Practice Benchmarks
What are the most important dental practice KPIs?
Core dental practice KPIs commonly include production, collections, overhead, new patients, case acceptance, hygiene production, recare, cancellations/no-shows, active patients, retention, and accounts receivable. Practices may also benefit from tracking communication and conversion metrics.
What is a good dental collection rate?
ADA practice-management guidance has used 98% of billable or adjusted production as a collections reference point. Practices should compare collections against adjusted production rather than assuming all gross production is collectible.
What is a good dental case acceptance rate?
ADA guidance has cited 75–80% or higher as a case-acceptance reference point. However, practices should consider how acceptance is calculated and may benefit from tracking both case count and dollar-value acceptance.
What is a good dental no-show rate?
ADA practice-management guidance has cited a combined cancellation and no-show rate of 5% or less. Practices should also track how effectively cancelled appointments are rescheduled or replaced.
What percentage of dental production should come from hygiene?
ADA guidance has cited a roughly 75% doctor / 25% hygiene production split as a reference point for a healthy general practice. The appropriate mix can vary by practice model.
How often should a dental practice review KPIs?
Core operational metrics may be reviewed daily or weekly, while a complete practice scorecard is useful to review monthly. Quarterly and annual reviews help identify longer-term trends.
Are dental practice benchmarks the same for every office?
No. Specialty, payer mix, geography, staffing model, services, patient demographics, practice maturity, and strategic goals can all affect performance. External benchmarks are useful context, but practices should also compare performance against their own historical data and goals.
Better Numbers Create Better Questions
The purpose of tracking dental practice KPIs isn't to turn dentistry into a spreadsheet. It's to see what your team can't see during a busy Tuesday afternoon.
A number can reveal that patients aren't returning.
That treatment isn't being scheduled.
That inquiries aren't becoming appointments.
That collections are slowing.
That hygiene capacity is tightening.
That overhead is quietly rising.
The number itself doesn't solve the problem. It tells you where to look. Ultimately, that's what a good dental practice scorecard should do.
Turn data into better questions, better decisions, and a healthier practice.
